Overview
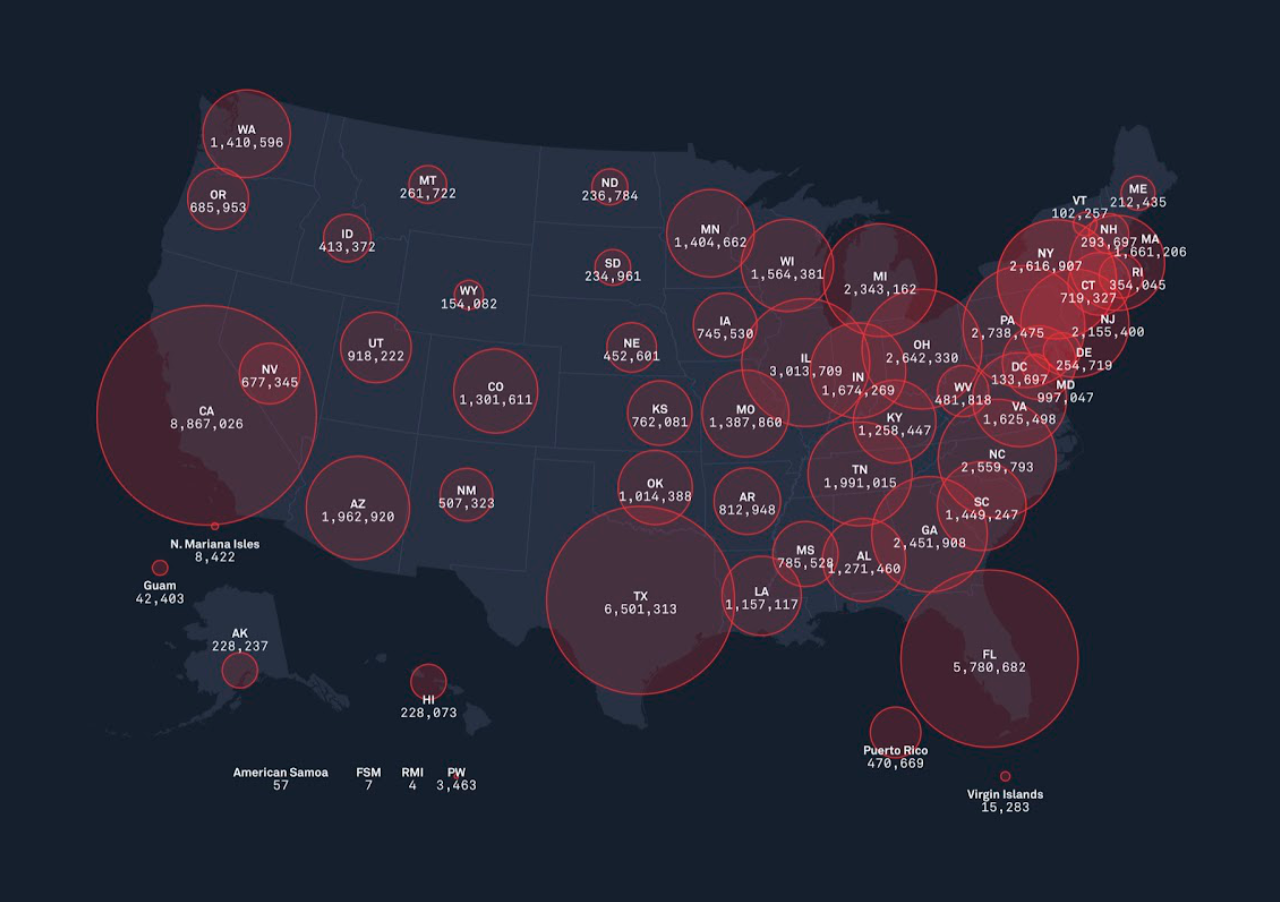
In March 2020, during a COVID-19 outbreak, the PBS NewsHour team was focused on preparing presidential election specials. Despite the limitation of production resources, we aimed to craft a COVID-19 map for our PBS member stations. By conducting comprehensive research and refining data, we managed to create an interactive COVID-19 map that illustrated the changing patient numbers nationwide. This interactive map has been widely shared among all PBS member stations, garnering over a million views.
Impact
This interactive map was released in March 2020 and distributed to 300 PBS member stations. More than two million visitors used this map over the course of the year. The average time per session of the top 20% users was longer than two minutes. The service has ended in late 2022.